

Games in San Jose are usually anything by calm or controlled. Saturday’s win for FC Dallas against the Earthquakes was in line with what we’ve seen in recent years against the Quakes. A wild game with a bit of everything in it. The stats reflect that as well. Both teams traded momentum, with Dallas finding success in transition and San Jose piling on the pressure with possession, shot volume and attacking sequences throughout the match.
Basically, this game was organized chaos wrapped in caffeine and poor cardiovascular decisions for everyone watching.
Let’s dive into the numbers from this one.
xG Battle/Attacking numbers
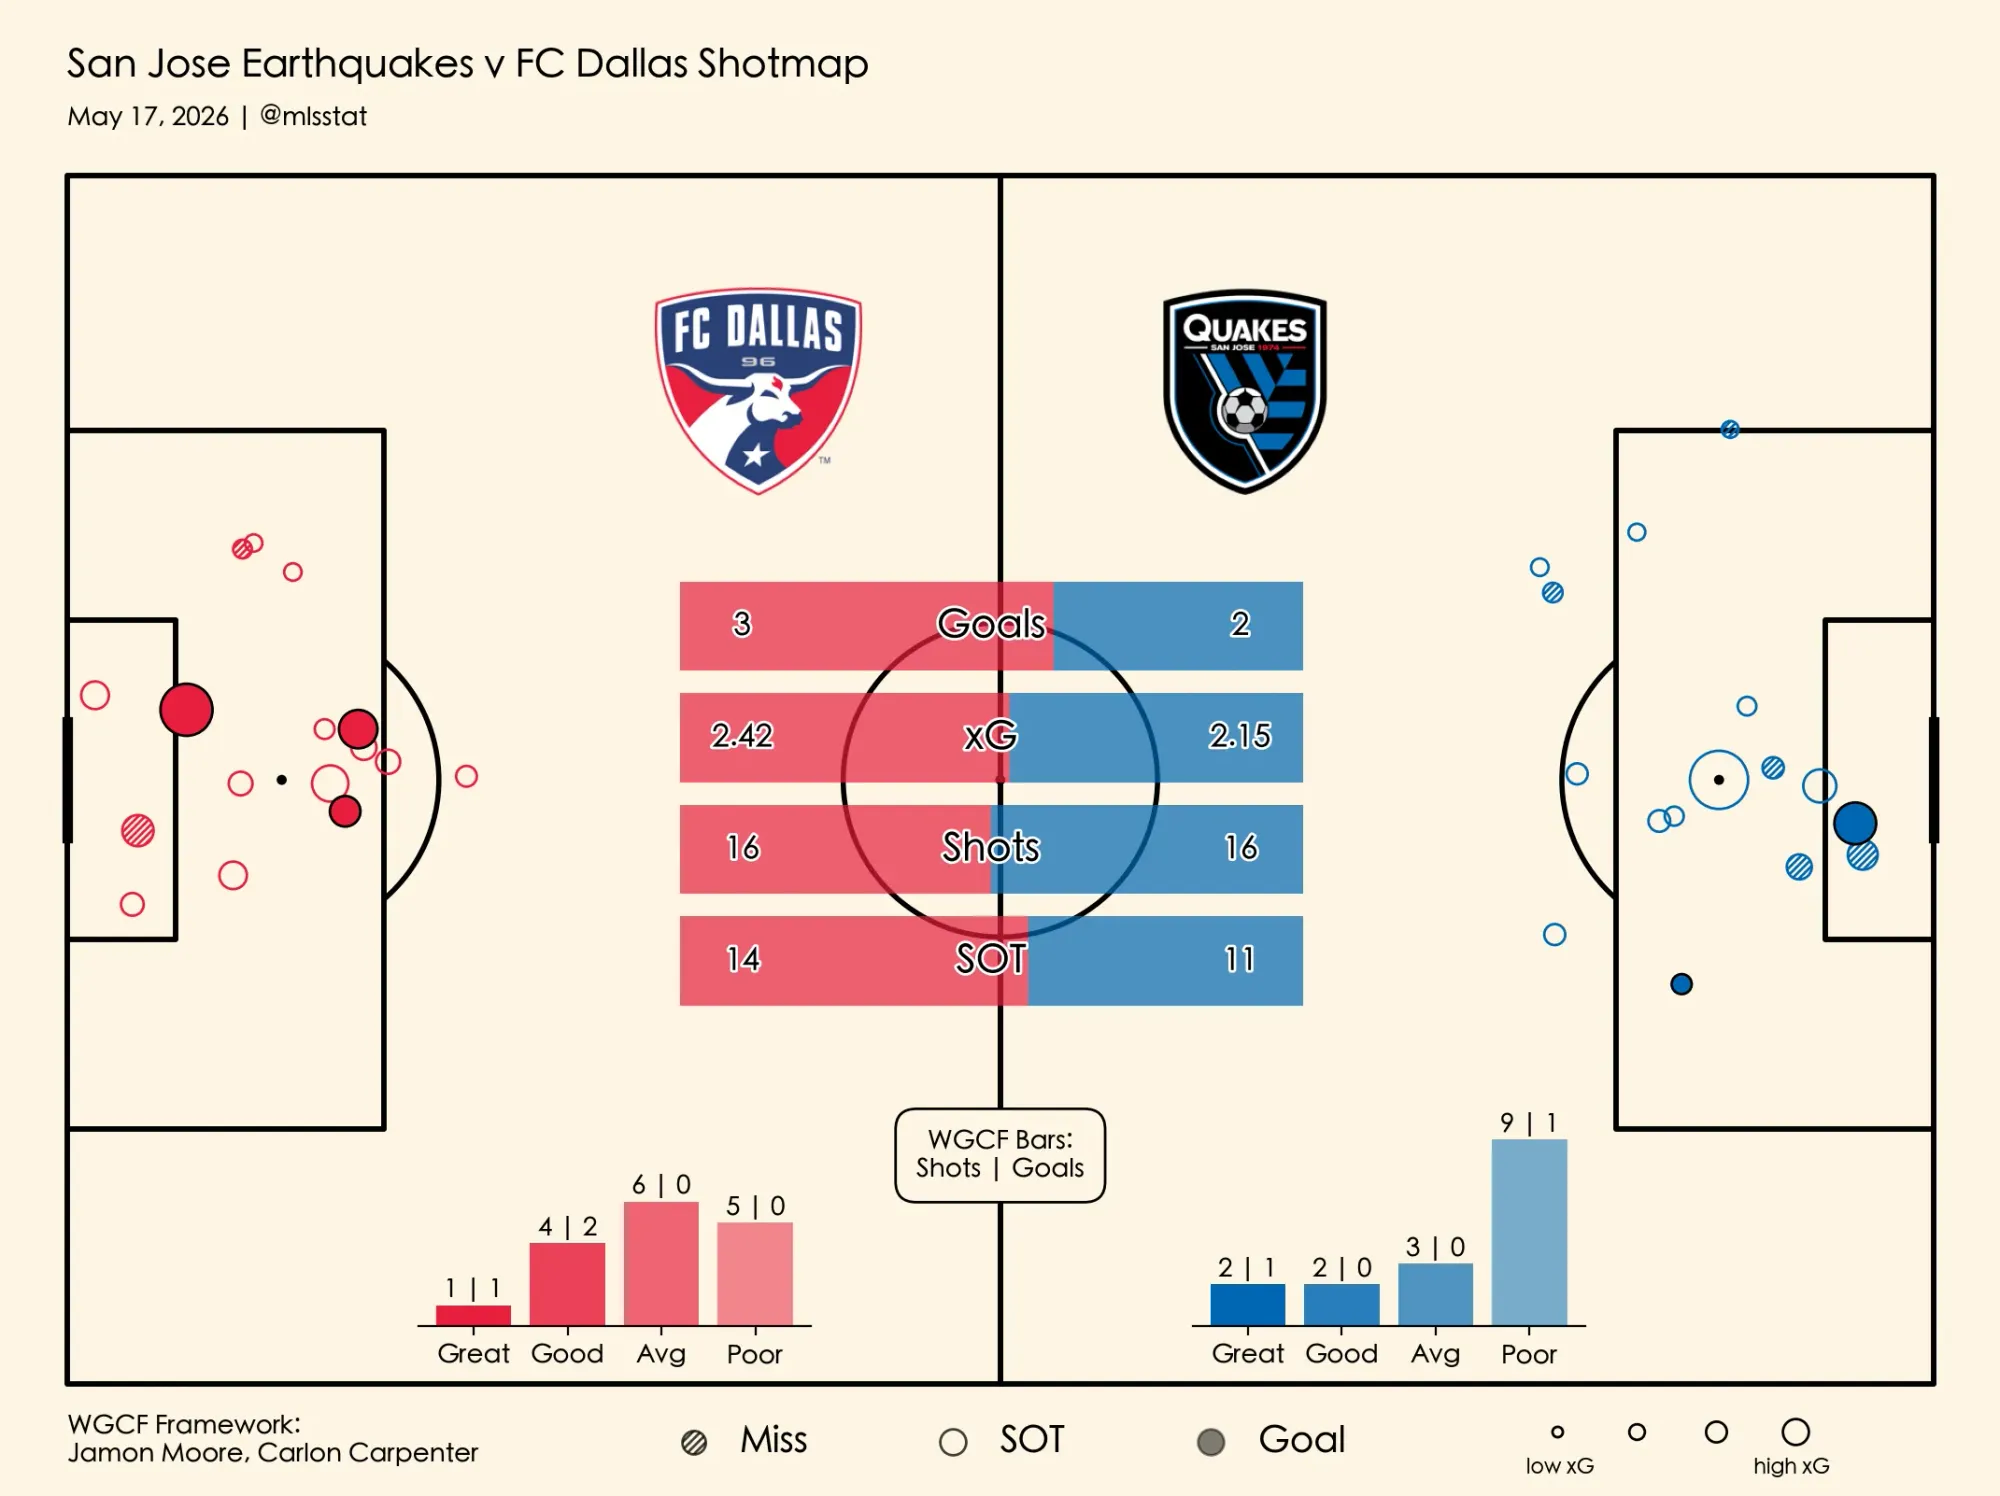
FC Dallas may have only ended the night with 45% possession (which feels like a far cry from the 30-or-so percent from the win over RSL a couple of weeks ago). But the attacking numbers show that Dallas was far more dangerous in transition and in advanced areas. Dallas matches San Jose on shots, while generating a few more on target. Dallas also got inside the penalty box a bit more than the Quakes, with 41 touches inside the penalty area compared to San Jose’s 30 touches.

Want to dive deeper into the numbers from this match? Upgrade to become a paid subscriber today!
The xG totals are also a tad misleading. San Jose‘s 2.15 is likely much lower when you factor out the missed penalty kick.
Those are some big splits when you consider how San Jose spent long stretches of the night controlling the ball.